The story of Moseley and X-rays
Henry (Harry) Gwyn Jeffreys Moseley of Trinity College, Oxford got a Second in Physics in 1910. His ambition was a career in physics research, and during his final year he was accepted by Rutherford to join his team at Manchester University, where he was appointed as Lecturer and Demonstrator. After working on a problem connected with beta-rays he became interested in the work that William Bragg and his son Lawrence were doing at Leeds. It was known that sharp X-ray lines were emitted by the target of an X-ray tube, and, using an X-ray spectrometer based on the Bragg's design, Moseley set about investigating how their wavelengths were related to the structure of the atom.
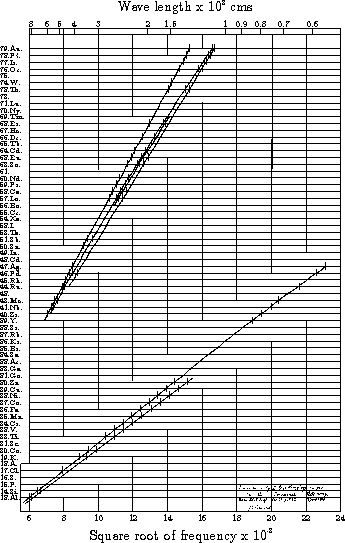
After some preliminary work at Manchester he moved back to Oxford to work in the Electrical Laboratory (now the Townsend Building of the Clarendon Laboratory). This was an exciting time for physics; Rutherford had confirmed the existence of the nucleus in the atom, and Bohr had just used this model in his theory of the optical spectrum of atomic hydrogen. Moseley devised an apparatus for bombarding samples of all the then available elements from aluminium to gold with electrons and measuring the wavelengths, and hence the frequencies, of the K and L lines in their spectra. He found that by plotting the square root of the frequency of the lines against a suitably chosen integer N a set of (almost) straight lines were produced.

This result was of the utmost significance for 4 reasons:
- This integer N could be identified as the atomic number Z, the number of elementary positive charges (or, as we would now say, the number of protons) in the nucleus.
- This dependence of the square root of the frequency on Z could readily be explained in terms of the Bohr theory, by applying it to the innermost electrons in the atom, rather than the outermost, as Bohr had done.
- There were gaps in the plot, corresponding to the atomic numbers 43, 61 and 75. Moseley had discovered elements without having samples of them! (The first two do not occur in nature but were later made by artificial means, technetium in 1937 and promethium in 1945. The third, rhenium, is very rare and was isolated in 1925.)
- The elements in any solid sample could be identified by measuring the spectrum of the X-rays it emits. (This technique is now widely used as a method of non-destructive analysis.)
The graph also shows two K-lines (the lower set) and four L-lines (the upper set). At the time there was no explanation for these multiple lines (and several other weaker lines not shown on Moseley's diagram) and this had to await the discovery of the spin of the electron and the quantum theory, as did the slight departures from linearity.
The First World War began in August 1914, and Moseley immediately, against the advice of his family and of the Army itself, volunteered for active service, and became a signals officer with the Royal Engineers. He was killed, at the age of 27, by a Turkish bullet on the Gallipoli Peninsula on 10 August 1915.
Had Moseley survived he would almost certainly have been awarded the Nobel Prize for physics. As to his subsequent career one can only hazard a guess. The speed with which he designed, had constructed, and produced results from, his apparatus in Oxford is remarkable even by present-day standards, and singles him out as an exceptionally vigorous and able experimenter. In fact his entire research career extended over only 40 months.
In 1915 Professor Clifton, the head of the Clarendon Laboratory, retired. Moseley would have been an obvious candidate for the chair, which was filled in 1919 by the appointment of Lindemann (subsequently Lord Cherwell)...
The Museum of the History of Science ( >6 Kbytes) in Oxford has some of Moseley's original apparatus amongst its many exhibits. This museum also sells a postcard (shown here - 25 Kbytes) which is reproduction of a 1910 photograph showing Moseley in the Balliol-Trinity College Laboratories, soon after his graduation. The original Moseley graph, drawn by his own hand, is in the Moseley room of the Clarendon Laboratory. The writing in the bottom right-hand corner, which is illegible in the copy above, reads "curve drawn by H. G. J. Moseley in 1914 in the Electrical Laboratory. (see Phil. Mag. Vol. 27. P703 April 1914) J S Townsend".
