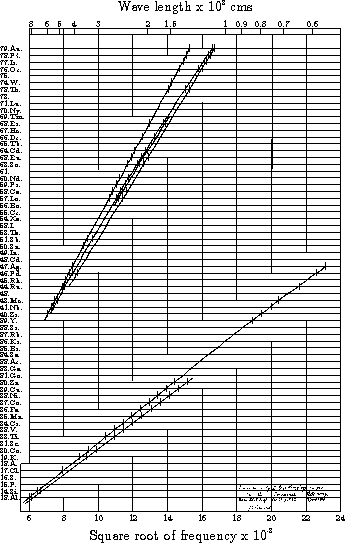
Exhibit 12 - Moseley's graph

The original Moseley diagram of the square root of the frequency of the K and L lines in the X-ray spectrum of the elements, against the atomic number Z. See also The story of Moseley and X-rays which will tell you what the writing at the bottom says.
This is the end of the present tour. We hope to add some more exhibits later.
